
The Simplest and Best Way to Protect Yourself from the Real Estate Crash
 As everyone knows,were currently entering a real estate market crash, where prices have already started to drop significantly. Unfortunately for many people this can have disastrous effects, possibly even causing many to go bankrupt.The good news is that today we’ll look at thesimplest and best way to protect yourself from the real estate crash, assuming you plan on holding your properties.
The largest unknown and/or neglected risk for most people is financing and refinancing. Yes, financing and refinancing! A lot of you have recently jumped into the real estate market and are new to financing. A lot of you have been in the real estate market for a while and have also just refinanced to save money, pull money out of your properties, and/or just to reduce your monthly payments. Almost everyone’s been sold on the benefits of today’s financing and refinancing, and rightfully so. We recently went through a real estate market phase were financing was very beneficial in many ways. However most people forgot to do their homework and don’t look at the details and future consequences of different financing and refinancing options.
You should definitely be VERY interested in the details and consequences of financing and refinancing if you:
- if you have a mortgage with less than 40% equity (that is your mortgage is for more than 60% of the value of your property)
- if you need to refinance your mortgage in less than 10 years.
What are the details and consequences? Why are these people very interested in the details and consequences?
Because when it comes time to refinance again they might be in for a very big surprise! First, if interest rates go up, as they are heading back to their historical average of 8-10%,monthly mortgage payments will increase greatly. For example, on a $250,000 property, going from a 4.5% fixed interest rate to a 9.0% fixed interest rate, the monthly payments will increase by as much as 58%. They go from $1,266.71/ month to somewhere between $1,829.20/month and $2,011.56/ month, depending on how you did your calculations (best to worse case scenario).To protect yourself from such a huge increase, you can lock your mortgage into today’s history breaking low interest rates. We probably won’t be able to beat today’s interest rates in our lifetime.
Now,assuming you can cover that additional monthly cost, will the bank be able to refinance you when your mortgage term comes up? What most banks, mortgage companies, and anyone else who wants your financing business probably hasn’t told you is that if interest rates go up, prices have to drop (the reverse is also true where if interest rates go down, prices generally go up, as we’ve recently seen in the real estate market). The general rule of thumb is that for every 1% interest rates go up, property prices have to drop by 10% to keep the same monthly payment. Although not entirely accurate, it’s close enough.
At first this might not seem so significant, but it’s extremely important. Assuming interest rates climb from 4.5% to 9.0%, a 4.5% increase, then that means thatreal estate property prices will drop by as much as 45%! It’s probably a little less when you add inflation, so let’s assume 30%, which still a very significant drop.When it comes time to refinance it in 5 years you will only be able to refinance up to the value of the property. In the past this wasn’t a big issue because prices were going up as interest rates dropped. However today, like the real estate bust of the 1980’s, it becomes a critical issue. Let’s work through a detailed example to see why.
 Let’s assume you bought a property today for $250,000 with 5% down ($12,500) with a fixed in interest rate of 4.5% locked for 5 years (variable works the same here except that your monthly payments will have increased throughout rather than only when you refinance). Now let’s assume 5 years go buy and interest rates have climbed to a historical average of 9.0%. Based on the previous paragraph, we’ll assume prices have accordingly dropped 30% to $175,000 (again not unheard of if you remember the 1980’s real estate crash as well as the Japanese real estate market collapse of the 1990’s). When you go to refinance your property, you’ll still have a balance of $227,336.39 due on your mortgage, which is more than 100% of your current property’s value.
No bank will give you a 130% mortgage, especially when the real estate market is falling. Therefore you will need to cover the difference of $52,336.39 between the balance remaining and your new property valuation ($227,336.39 – $175,000). On top of that, because that only brings you to a 100% financed mortgage, you will need to add another 5-25% to cover some equity on the property.This means that in 5 years, not only will your monthly payments go up by as much as 58%, you’ll also need to come up with more than an additional 21% lump sum payment of your initial purchase price just to be able to refinance for a 100% financed mortgage, which no bank will accept. In reality you’ll need to come up with more than $60,000 just to get a 95% equity mortgage, which will be very tough in a down market.
Let’s take another example, a less severe example. Considering that interest rates have already gone up more than 1% in the last few months, a 7% interest rate in the near future should not be too surprising. In this case your monthly payments will have increased anywhere from $1,512.47 to $1,663.26, an increase of up to 31%. Your property will now drop by at least 15% to $212,500, meaning that you’ll now have to cover the difference between your balance remaining of $235,038.47 and new property valuation of $212,500, a difference of $22,538.47. Add at least another 5% equity down payment and you’ll need to come up with more than a $30,000 lump sum payment just to be able to refinance.
Therefore the greatest piece of advice I can offer you at this time to protect yourself from the real estate crash is to refinance your mortgages with today’s extremely low fixed interest rates and lock in those rates for at least 10 years, preferably more. Also, have the mortgage both transferable and assumable in case you decide or need to sell. Why 10 years? Because no real estate crash in the last 50 years has lasted more than 10 years, prices have always come back within 10 years of the start of a real estate crash. Although it’s not a guarantee, no one can guarantee the real estate market’s future,it’s a good bet that this real estate crash will be gone within 10 years or less.
Again, the details of financing and refinancing are especially important for those of you that have highly leveraged properties or that have to refinance within less than 10 years. The good news is that if you do your math and you prepare yourself ahead of time then you’ll be able to safely ride out this real estate market crash. Not only that, you’ll be in a great position to catch the next real estate market boom wave before everyone else, which is where the big money is made.
Permalink to this article Discussions (3)
How to Really Annoy And Lose Your Customers
Recently I had the unfortunate experiencing of almost losing a hard drive on my computer, which means a lot of important data. Luckily for me it ended up being a memory chip that was bad, however it could have been a lot less fortunate. I know lots of you are saying I should have everything backed up, and I usually do. But if you’ve ever done a restore, you always find out that you missed something or other, usually something very important.
 In any case, it made me think about some recent purchases I had made from Symantec (Norton Anti-virus) and ACDSee. Both of these companies offered something called an Extended Download Service for which they charge. Before I go on, please note that I’ve purchased these software applications therefore I find them useful and beneficial. However that being said,I think the Extended Download Service is a really good way to annoy and lose your customers!
A company that offers an Extended Download Service generally allows you to download the software you purchase for a limited number of days, usually 30-60 days. After that, it’s up to you to keep a backup copy should something happen to your computer.If it crashes, if gets infected with a virus, if an act of god destroys your computer (such as Hurricane Katrina)then you will be charged a fee to re-download it if its past the initial 30-60 days, a fee for a product that is currently available online free for new purchases. It’s the exact same download, there is no large additional cost to re-download it.
I promise you to the very best of my abilities that LandlordMax Property Management Software will NOT charge a fee for re-downloading software which you already own. It just doesn’t make sense.When your customers are their worst hour, their time of crisis, when they need you the most, you charge them for help! What a really good way to annoy them. When I’m at my most frustrated, these companies create an obstacle for me to use their software product. I just don’t get…
 I can understand not providing a link to obsolete software. However if your license is up to date for the current version of the software, why shouldn’t you be able to re-download it? For example we’ve had many customers here at LandlordMax who were affected by Hurricane Katrina. One particular customer we were in contact with had lost home and had their business destroyed. With this they lost their computer, their data, and pretty much everything else. It wasn’t a very pretty picture. Should we charge these people an additional fee and make a handsome profit at their worse hour when they need us most? What if it’s not a catastrophic event, but rather their computer hardware crashed hard and they lost all their data? I’d rather be known and remembered as exceeding expectations during their time of crisis then as increasing their pain and be associated as part of their bigger more painful problem.
Be part of the solution, not the problem!
Permalink to this article Discussions (1)
7 Simple Tips And 5 Secrets to Increase Your Credit Score
In last weeks article I suggested that your credit score can greatly affect your real estate investment property’s cash flow. Today as a follow-up, we’ll go over 7 simple tips and 5 secrets to help increase your credit score.

7 Simple Tricks:
1. Always, always, pay your bills on time. Late payments and collections can have serious consequences on your credit score. Your payment history is a major factor as it represents 35% of your credit score.
2. Do not apply for credit too frequently. This will decrease your credit score because this is a characteristic of high credit risk groups.
3. Keep your credit-card balances low. If you’re “maxed” out on your credit cards, this will affect your credit score negatively. A good rule of thumb I’ve heard several times is to keep your credit card balances at or below 25% of your credit limits.
4. Fix any mistakes you have with the major credit bureaus right away because it can take time and have significant impacts. This entails getting in touch with the lender to verify that the information is accurate. If the lender can’t confirm or doesn’t respond, then the information is removed from your credit report. Also, if you have paperwork proving that the information on your account is false, send it to the credit bureaus and keep copies of everything.
5. Hang on to your old card because the credit bureaus reward loyalty. 15% of your credit score is based on the length of your credit history, and that includes the age of your oldest account as well as the average age of all your accounts. In other words, lenders want customers who will stay around and not move their accounts to whoever has the lowest current introductory offer.
6.Don’t bother to close accounts that have had missed payments or have had collections. Open or closed, they will be part of your past credit history for some time.
7. Being self employed is not good for your credit rating, fortunately you can plan ahead (as described in the 5 Secrets section). Many lending institutions, especially banks, won’t even look at you if you’re self-employed. If you plan on being self-employed consider a corporation because you can be “employed” by the corporation, however please note that even with a corporation it generally takes at least 2-3 years of consistent income before most lending institutions are ready to talk to you again.
5 Secrets:
1. For credit cards that are “maxed” out or have balances above the 25% rule of thumb, and you have no way of reducing the balance, fortunately there are other means to bring their ratios to more preferred levels. Remember that although the rule of thumb is to have no more than 25% of the maximum balance on credit, it doesn’t state just how much that 25% amount is in real dollars. Therefore another option is to increase your maximum balance. So for example, if you have a $1000 credit card and you owe $500 on it (a 50% ratio), then if you increase the balance to $2000, your ratio is now a preferred 25%! Just remember not to use the card anymore otherwise you will lose that preferred ratio.
2. Every time you do request a loan and the lender pulls your credit report, it generally reduces your score by a few points. It is part of the credit score formula to handle people trying to apply for credit and loans to live beyond their means. As another general rule, keep your loan processes within two-week periods so that all of the credit report lookups are bundled together to appear as one single request (such as trying to achieve the best rate for a mortgage).
3. Avoid using credit card introductory offers if you can. They might help you in the short run financially, or get you out of difficult debt, but as a long term solution they will most likely hurt you. Lenders want to acquire customers that are loyal because there is a cost associated for each loan. They would rather lend money to someone who is very likely to stay than someone who has a very unlikely to stay and move their money over at the next good looking introductory offer.
4. If you have little or no credit score, a quick way to bring up your credit score is to acquire debt. If you don’t pay off any debt, then how can you show that you’re a good borrower? Acquire some debt and pay it off. I’ve seen too many people looking to get their first mortgage denied simply because they’ve never acquired any previous debt before. They’ve paid everything in cash and they’re very proud, which they should be! However, you still need to establish a track record before someone will loan you bigger amounts, such as a mortgage. You need to prove your trustworthiness. Buy a car with a loan, get a credit card, get a personal loan, and basically establish some track record. At a bare minimum, borrow at least a few times before you go looking for larger loans.
5. For those of you looking to be self-employed, it’s crucial that you get all the loans you’ll need for at least 3 years now, probably even longer. Once you become self-employed it will be extremely difficult if not impossible for several years, therefore be prepared. Now I’m not saying use it, all I’m saying is that you get it. Increase the maximum on your credit card, get that line of credit, etc. Prepare for inflation, for future needs, etc. To use the cliché, an ounce of preparation is worth a pound of cure.
Related Article: A Lesser Known Secret Tip to Increase Your Credit Score
Permalink to this article Discussions (191)
How Your Fico Score Can Greatly Affect Your Cash flow
I recently read an interesting magazine article, again this time from Business Week, about how your Fico score can affect your housing affordably. Taking that one step further, it can also greatly affect a real estate investor’s cash flow. The very same property can be cash flow positive for one real estate investor while being cash flow negative for another. How? With the aid of MyFico.com, let’s take a look at the difference in cash flow (assuming no other costs than the mortgage to greatly simplify this article).
Using data directly from MyFico.com, below is the interest rate and mortgage amount for a $150,000.00 rental property with a 30 year fixed mortgage.
| Fico Score | Interest | Payment |
|---|---|---|
| 760-850 | 5.94% | $1,287 |
| 700-759 | 6.16% | $1,318 |
| 680-699 | 6.34% | $1,342 |
| 660-679 | 6.55% | $1,373 |
| 640-659 | 7.53% | $1,435 |
| 620-639 | 8.96% | $1,515 |
As you can quickly see from the table above, there is a large difference, up to about 1.5% difference in interest rates based on the FICO score alone. The amount difference is $228/mth to the cash flow bottom line! That’s a huge difference!
In other words, a real estate investor with the highest FICO score can buy a residential rental property up to 18% more expensive than one with the lowest FICO score! That or they can make 18% more cash flow which is even better!
Therefore, another way to increase your cash flow from your real estate rental properties is to increase your own personal FICO Score.
Permalink to this article Discussions (0)
LandlordMax Property Management Software Status Update
There’s good news and some not so good news regarding the next major release. First some of the good news. We’re almost done with major architectural changes which include a complete change of the database engine. It also included a major change in the way every table is displayed so that they can be sorted by any column, etc. These changes have been substantial structurally speaking, it’s as though we changed the engine and some of the internals in a car. The not so good news is that these changes have been harder than we expected, and therefore are taking longer to complete.

Sorted Table Columns
What does this mean for you? It means that the latest major release of LandlordMax Property Management Software (version 2.12) will be postponed until February of 2006. In my personal opinion and experience, it’s unwise to force a premature release with major changes this complex out before it has been completely tested, especially considering that next month is X-mas when most people go on holidays (not to mention the X-mas plans of our beta test members). What we’ll do instead is release it in February of 2006, but the good news is that we’ll mark the version as though it was released in December of 2005, giving you all an extra 2 months of free upgrades! I would rather absorb this cost than release a sub-standard version of LandlordMax.
If you’re interested in finding out more details about this release, please read on here…
Before I get into details, let me just say that this has been our most extensive release by far to date. There will be many new features in LandlordMax Property Management Software, not to mention reports, however the biggest changes and costs have been structurally.
Indeed, our biggest cost was changing database engines. Although it might appear simple, where we can just swap database engines as the theory suggests, reality does not work this way. Our prior database engine (hsqldb) had some shortcomings that we worked around that no longer apply to the new database engine (derby). On top of this, we could do some things with the old database engine that are no longer possible with the new one. If you want to read about why exactly we changed database engines, you can find my prior article here.
The hardest task for us in changing database engines wasn’t just the hook ups, it was to make the process of upgrading from one database engine to another seamless, that is to make it happen without the user being aware of it. I know that if I personally bought a product defined as the easiest in its category, I wouldn’t want to know the details of how it worked internally. As an analogy, if I swapped a car’s engine, I would want it to start by turning the key just like it before, I don’t want to manually change the engine myself, or have a bunch of new toggles to manipulate. I just want to turn the key, that’s all. And as you all know, changing a car engine is not a simple task!
The next biggest cost for us was re-structuring each table to give it the ability to sort by any column. I won’t go into the details, but suffice it to say, I wrote a whole article here a while ago about the complexities of it, so if you’re interested please read it. I didn’t realize until after writing about how much effort we had put into it. In any case, after having gone through the process, we decided that to release this version in a timely manner, we would forgo the concept of hierarchical tables (tables that can be collapsed and expanded), which would be nice for reports such as “All accounting entries grouped by categories”. Therefore this has been postponed to a future release.
Another major feature that we’ve added is the ability to store pictures in tabbed panels for the building, unit, and tenant workareas. The pictures will be listed in a thumbnail view and can be clicked on to be displayed in a larger popup window. This is a feature that was greatly requested and we’ve been doing our best to implement it. We’re currently in the final stages of developing this new feature.
Although we anticipated having graphs in our reports, due to time it took us to sort the tables (reports), we have come to the conclusion that this feature will have to be postponed to a future release. Graphs would be a great feature, however due to the sheer number of reports, it will take a considerable amount of time to fully implement. It has therefore been postponed also.
The reports section is still anticipated to have several new reports. We’ve already added several and we expect to have a few more before we release it. I won’t go into the details of listing the reports, but suffice it to say that we’ve added many of the reports that have been suggested to us (also every report that is not grouped by something can now be sorted by any column, as well as printed in that sorted order).
There are several other significant changes that I won’t go into details here, but they include the ability to add your logo to the printed reports, auto-update reminder when new releases become available, new fields, etc.
As I mentioned before, I would prefer to take an additional two months to properly prepare the software for release rather than going live with an incompletely tested version next month. Because of this delay, we will honor the release as if it was in December of this year (I doubt many other software companies would do that), and we will do our best to get it out to you as soon as possible. I will keep you updated of our progress because I’m sure that you appreciate it as I would.
Permalink to this article Discussions (0)
Asset Risk Management
Today’s article has been inspired from a book I’m currently reading entitled Fortune’s Formula. Although the book is fairly verbose, it’s worth the read because it does have some very interesting insights and ideas. The main focus of the book is how to manage risk of your assets, regardless of what the asset is. For example, it compares the Kelly System (original paper in pdf format), the Markowitz system, etc. The basic idea is how can you increase your wealth the fastest while minimizing your risk.
Although I’m not yet finished reading it, one chapter really caught my attention. entitled “Shannon’s Demon”. In there the author (William Poundstone) talks about a system devised by Claude Shannon where it appears theoretically possible, and I’ll explain why I say theoretically in a bit, to make profit from the fluctuations of an asset (both when it goes down and up).
The system is very simple and elegant. You start with a certain amount of cash, let’s say $200. You divide this sum equally into cash ($100) and the asset ($100). Then each round (time unit which can be minute, hour, day, month, year, whatever) the asset either doubles or halves. Yes, it can halve and you can still make money! Now at the end of each round you rebalance your portfolio to split the cash and assets 50/50. So for example, if the asset doubles to $200, then you rebalance your wealth ($300 = $200 asset and $100 cash) so that you have $150 in cash and $150 in asset. If it halves, you rebalance it ($150 = $50 asset and $100 cash) so you have $75 in each. You repeat this for as many time steps as you want and you will find that the result is a geometric (i.e. exponential).
In the previous paragraph I allude to the idea that it was theoretically possible. Why did I say this? Because reality doesn’t quite allow for this system to be possible. Firstly, if you were to wait until real estate or stocks doubled and halved it might take a very long time. Therefore this would only be possible with games of change with an even odd of winning and losing. The other aspect is that if you actually went ahead and did this with either real estate or stocks, you’d have to take into consideration fees of buying and selling the assets, not to mention tax considerations. However, ignoring these aspects, it’s a very interesting and thought provoking idea because it really helps to appreciate that it is possible to make money on volatile assets that move up and down.
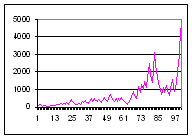
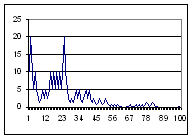
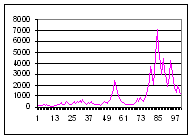
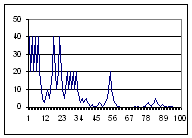
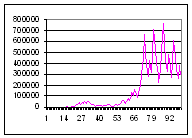
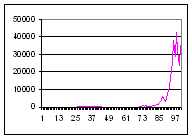
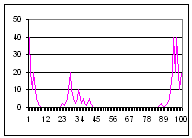
I took a few minutes tonight to write a simple Java program to test this concept. For you technical people, you can find the source code here and the class file here. The program will output to the screen tab delimited lines which you can use in MS Excel to generate the graphs. In any case, I ran it a number of times with runs of 100 time units with equal probabilities of the asset going up and down. What was very interesting is that no matter what, assuming the asset didn’t go bankrupt, you made exponential revenue. If the asset did go bankrupt, you still made a nice profit up to that point (assuming it didn’t go bankrupt right away and lasted for at least a few up movements). You’ll find 5 of these sample runs below with the wealth graph on the left and the respective asset price graph on the right (the asset always started with a $20 value and the wealth with $100 cash and $100 in assets).
Scenario 1 (Data File)
Scenario 2 (Data File)
Scenario 3 (Data File)
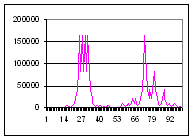
Scenario 4 (Data File)
Scenario 5 (Data File)
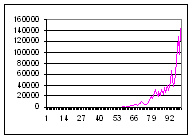
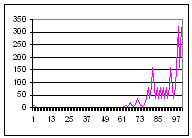
As you can see from every single graph above, no matter how low or high the asset price went, it still seemed to generate a handsome profit. Although I didn’t post any of the graphs where the asset loses all of its value, you can see from some of the examples that even when the asset price is almost completely wiped out the wealth graph is still much higher than the original $200 in wealth. It’s also much higher than if you had just stayed and rode the stock all along!
Of course please don’t think that I’m proposing that getting in and out of the assets is necessarily a good thing, because like I mentionned before, once you start to take into account the transaction costs and capital tax costs, not to mention the amount of time it takes for a normal asset to double and halve, it pretty much makes this model impossible. I still strongly believe in the buy and hold model and therefore this article is more to bring forth some new ideas and ways of thinking about assets and risk management.
Permalink to this article Discussions (3)
Location, Location, Location
Everyone has heard the cliche that the three most important factors in buying a property are “location, location, and location“. Just how important is location in determining the price of property? It’s very important. I came accross a study this week done by Coldwell Banker which compared the prices of properties. The study surveyed prices of similar homes in 324 real-estate markets for a similar 2,200 square foot, four-bedroom, two-and-a-half bath, two-car garage house. The difference between the most expensive and the cheapest was very large! The biggest gap was between La Jolla, California, and Killeen, Texas. You could either own 1 of these properties in La Jolla, California, or 14 identical ones in Killeen, Texas! And with even with the 14 properties in Killeen, Texas, you’d still have $36k left over!
Why such a big difference? Because of the desirability of the locations. La Jolla is a beautiful city California perched on the Pacific Ocean with lots of coastal properties, it has year round beautiful weather, lots of amenities, and so on. In contrast, Killeen is a city built around an army base in the middle of the prairies with much harsher weather. Should the discrepency be so large? That’s a debatle subject, however the reality is that it is.
| Most Expensive Markets | ||||||||||||||||||||||
|---|---|---|---|---|---|---|---|---|---|---|---|---|---|---|---|---|---|---|---|---|---|---|
|
| Least Expensive Markets | ||||||||||||||||||||||
|---|---|---|---|---|---|---|---|---|---|---|---|---|---|---|---|---|---|---|---|---|---|---|
|
Permalink to this article Discussions (0)
Some Markets Are Already Starting to Fall. Good Times Ahead for Real Estate Investors
Today I came across an article online from the Boston.com entitled “Suddenly, area’s housing market favors the buyers“. This article was very interesting for several reasons. Firstly it seems to indicate that several real estate markets are starting to collapse, as I’ve been predicting for a while now. Also, although the article states many reasons for the decline in real estate property prices, I personally believe that the main contributor is the increase in interest rates. This is good because it makes it much easier to calculate approximately how much the real estate market should fall.
In any case, the good news for real estate investors is that there will be profitable cash flow rental properties available in the market once again. So start preparing your finances to be able to capitalize on it.
Some interests highlights and exerts from the article:
- In Jamaica Plain, a $70,000 price cut (15% of the total purchase price) for a house on the market for about a month generated only four people for an open house (two of which were the neighbors).
- “‘My seller is willing to consider a lower price’, said the broker, Anne Connolly, ‘but there’s no buyers to deal with.'”
- One Remax broker said that she is still selling houses, but at prices 5-to-10 percent lower than what comparable homes sold for in spring.
- “the number of condominiums listed for sale is up 50 percent from a year ago, while the number of price cuts has more than doubled“
- “Recently, after viewing a home in Norwell, listed at $645,000, Brown was told as he walked out, ‘We’ll take $535,000.’“
These are all very telling snippets of information from this article! All six reveal just how the market is truly doing. Again, as I mentioned before, this should be great news for real estate investors. Money is made in low markets, not high markets, so prepare yourself because the market is about to get very interesting in the near future!
Permalink to this article Discussions (0)
LandlordMax Property Management Software Backstage Pass
Today’s article will be a backstage pass to one of the new upcoming features being added to LandlordMax Property Management Software. In particular, today we’ll talk about what’s involved in adding column sorting on all the tables in the upcoming release. We’ve been working hard to get this new release of our property management software up and running and I figured it would be a nice change to give you our readers a chance to see exactly what’s involved in adding a new feature.
We’ve had a lot of requests for many features. One of the most common has been the ability to sort any column in any table in LandlordMax Property Management Software. This article will talk about how we’re adding this feature. I’ve tried my absolute best to keep it as least technical as I possibly could. So now that you’re interested, let’s start reading how it’s being done!
The very first thing we needed to do before we even started to implement this feature was to learn how to sort tables in Java. You see this is not a built in function of the Java programming language, it’s something that needs to be implemented. There are hooks into the language to make it possible; however we needed to learn how it works. The good news is that there are lots of books and websites out there to help us out.
After doing some research, we came to the conclusion that we would be ahead by buying a component library from another company called JIDE Software. What this means is that we would buy the programming code from another company that would sort the table for us. You see there are many companies that exist only to provide components for other programs like LandlordMax Property Management Software to use. These can include web browsers, email clients, table sorting, etc., all components that you can directly integrate into your software.

We could have done it ourselves, but we quickly realized it would have cost more than the cost of purchasing it, and not only that but the component library has a lot more features that we could use in the future. For example, we can later add the concept of hierarchical tables. That is, tables where we can expand and collapse whole groups of rows, something that would really benefit some of our reports, such as “Accounting entries grouped by categories” as illustrated in the image above. With this feature, we could collapse/expand all the accounting entries for a particular category in the report, to help us better isolate only the information we want. Another great looking feature is that it gives you the ability to choose which columns to display, so that you can remove columns you’re not really interested in. There are other great features, however unfortunately because of tight the timelines for this release, a lot of these niceties will have to be postponed to the next major release. The good news is that these are furthers features you can expect in our future releases.
In any case, all these features are not free. With this particular component library that we purchased, for every 1000 customers we acquire we have to pay one additional license fee to them which is definitely something we need to be conscious of. We currently believe this is worth the cost.
Although it might look like there’s not much work left from this point because we purchased a library to sort the tables, there surprisingly is! This is only a very small part of the puzzle. The next thing we needed to do was to define each column, and how they were to be sorted. In Java, there is something called a Comparator. This allows two Objects to be compared to each other, so that you can determine their order. Therefore, for each and every table, and for each and every column, we need to define which type of Comparator to use. Is it a Date Object Comparator, is it a Currency Comparator, is it a Number Comparator, is it a String Comparator, etc. Considering the number of tables we have, not to mention reports, you can quickly see that this adds up to about 200 tables times the number of columns. This is a lot of definitions!
Now unfortunately for us today, in the previous versions, because we didn’t have the notion of sorting on the columns, we took some shortcuts in the code to save time (a normal programming design decision to not implement everything and rather only implement what you need today). Actually we did it then for two reasons. But before I go into how it affects us, let’s quickly look into the concepts of Java tables. First and foremost, each entry in a table is an Object. That is if it’s “hello”, “hello” is a String Object. If it’s a date, then the representation of the date is a Date Object. The problem is that when you use a Date object, how does the table know how to display it? Is it 2005/10/10, Sept 15, 2004, 05/23/2005, etc.? This is where the Java language built in something called a Renderer. It takes an Object and renders it into something that we can use, hence the name Renderer. So for example, it will take a Date Object and render it as “Sept 15, 2004” in our table.
This is a great feature of the language because it allows us to store the Objects rather than just their string representations. Imagine if we could only store in the string representation for dates. If I sorted “Sept 15, 2004” and “December 23, 2004” alphabetically then “December 23, 2004” would come first. However if I sort them by their Date Objects, then I can use the Data Comparator above to compare them one to another and correctly sort them by date.
As I mentioned this is a great feature. However in the previous versions of LandlordMax Property Management Software, because we didn’t have any sorting, we didn’t need to store the actual Objects, we could just store the string representation. This would save us all the trouble of writing Comparators as well as Renderers. In essence, this saved us a great deal of time! However today, because we want to add sorting, we need to revisit where all our tables are created to convert the string representations back into Objects and add Renderers to all appropriate fields.
The good news is that we can re-use a lot of the code, we only need to write one Comparator and one Renderer for each type of Object, say our Date Object for example. The bad news is that we need to go through each and every table and convert the string representations to their respective Objects, associate the appropriate Renderers and Comparators. We need to do this for about 200 tables times I don’t know how many columns. This is a very large task!
Although this might seem like it’s the end, it’s not yet the end! Because we knew the Object representing the list of data and table itself we’re identical, they didn’t change order and so on, we could use another shortcut and just reference the Object list at the appropriate position in the list to access the selected Object. So for example, in our list of tenants, if we double clicked on the 10th tenant, then we could either choose to select the 10 item in the table or the 10th tenant from the list of Tenant Objects, either worked. We chose the later because we could greatly automate the process in our code. Today this is no longer true, the 10th tenant from the list of Tenant Objects might not be the 10th tenant in the table (depending on how it was sorted). We therefore needed to change all the code that referenced these Tenant Objects from the list to get them from the table directly and not from the data Object lists. That’s at least another 200 code changes.
It doesn’t end there. Because we don’t display every attribute of an Object in the table, we need to store that Object hidden in a column in the table. So for example, our Tenant Object can contain additional information that we cannot display in the table, such as all the accounting entries associated with that tenant. Therefore, we cannot reconstruct our Tenant Object from only the values in the table, it’s just not possible. Therefore, we’ve had to append our Objects (in this case our Tenant Object) as the last column in each of our tables. Another 200 code changes!
By default all columns are displayed. Therefore we now need to go through every table and hide the column containing the Object itself in the table. We don’t want to display this column, it wouldn’t make sense. Another 200 code changes!
We’re getting there, but there’s still more code changes required. What about printing? Will the printed table match the sorted table? I don’t know yet, we haven’t gotten to that part of the code yet, but in essence we need to verify that all 200 tables correctly transfer their table data to the printer, and not the list of data Objects (because these would no longer be correctly sorted).
Are we there yet? Not quite! Because all our tables are completely refreshed every time you change screens and/or workareas, we currently lose track of which columns were sorted. We’re now looking at how we can manage to keep track of which columns where indeed sorted and in which order so that when you return back to your table, you don’t need to resort it again. Will this require another 200 changes? I don’t know yet because this isn’t completed either, but I suspect that it can be greatly automated and not require 200 code changes.
What other changes are there above this to handle sorted tables, I’m not sure… However, by the time the software is released, you can be assured that this will be completely done as well as all the other features we add. This is why if someone ever asks me if a feature will be available in the next release, I will only say it’s anticipated until it’s 100% completed and tested. You can never be 100% sure it will make it into the product until its 100 completed!
I hope that you found this article informative, that you now have a better understanding and appreciation of what goes into building each and every version of LandlordMax Property Management Software. Although software may seem simple to build on the surface, there’s often a lot of hard work involved. There’s a reason why there’s not a lot of good software, and that’s because it’s hard to do!
Permalink to this article Discussions (0)
Why do Real Estate Investors Not Invest in Stocks the Same Way They do in Real Estate?
Although it’s a discussion I’ve had a number of times before in the past, this weekend it re-occurred again. Although not directly in the context of investing in real estate, the concepts are the same. Basically, I’ve seen this happen over and over again, people who invest wisely in other assets (business, real estate, etc.), don’t always use the same principles when investing in stocks. I don’t know how the last people I had this last discussion with invest (we didn’t discuss those details), but the discussion did come up which prompted today’s article.
Often I see many wise real estate investors, wise business owners, and so on, look at the whole of their related investment, do their due diligent, and then only invest in income generating ventures. However these same people will then often completely ignore the same investing principles when dealing with other assets such as stocks! How? Why? I don’t know. If you look at a buying an investment real estate property, you will look at its total cost, at its cash flow, etc. When looking at a stock, you should do the exact same thing. Same concepts, same principles, same research. However the reality is that most people don’t.
In this article we’ll go over how and why you should look at stocks the same way as buying other assets such as investment real estate, businesses, etc.
Let’s start by looking at a basic deal. When you purchase an investment real estate property, you’ll want to look at the total price of ownership to decide if the property is expensive. That is, you want to know what the property is selling at. If you buy a business, say a Subway franchise down the street, you also want to know how much it’s going to cost you to invest in it.
When people buy stocks, more often than not, they want to know the stock price. Then based on this stock price they’ll determine if the stock is expensive or cheap. That doesn’t work! Think about it this way, stocks are only partial ownership of the company you buy stocks in. If you buy a share of Microsoft at $10/share or $40/share, you don’t own the price of the whole company, so how do you know if that’s expensive? If I sold you part of a real estate property for $10 or $40, how do you know which is worth more? You DON’T! You can’t with just that information. Why? Because how do you how big a piece of the pie that share is worth? What if for the $10 a share of the real estate property I sold you there are 1,000,000 shares? That makes the property cost $10,000,000. Now what if I told you the $40 a share real estate property only had 10,000 shares, making that property cost a total of 400,000! That’s a drastic difference! That’s the reality of stocks. That’s why many people fail at investing in stocks. If someone doesn’t even know the total cost of ownership, then how can they be investing? That’s gambling. If I bought an investment real estate property without knowing how much it truly costs, then how could I be expected to make a profit? I couldn’t! Whether or not I did would just be luck.
It’s very easy to get the total price of any publicly listed company, that’s what called the market cap. The formula is as simple as I stated above, the total number of shares multiplied by the cost of each share. This number of course changes daily, because stock prices change, but in any given instance you can quickly determine the total price of a company. Because it changes, don’t expect to be 100% accurate, just use it as a ballpark figure. Like in our example above, we can quickly have an idea of what’s what without needing to know it’s precisely $40,192 versus $40,000 compared to precisely $10,234,725 versus $10,000,000.
Now that we know how to calculate the total cost of ownership, then the next thing that should come to your mind is what is its true value? One theory, the efficient market theory, states that the market always accurately reflects the true value in the stock price. That is to say, the stock is worth what its selling for because everyone has all the information now and can correctly evaluate it. The reality is that it’s not efficient! Stocks are bought by many people, many who know what they’re doing, and many who don’t. Stocks are bought on gambles, stocks are bought on information, stocks are bought on name recognition, stocks are bought on tips, stocks are bought on emotions, stocks are bought for almost every reason.
What this means is that the actual value of a stock is not necessarily what it’s selling for, just like real estate, just like businesses. However the good news with stocks is that the discrepancies can be much larger than they will ever be for real estate properties. For example, if you look at the dot com boom and bust, the discrepancies were incredible! At other times, in a down market, prices can also be much below their true value. It’s possible to buy stocks for much less than they are worth, just as it’s possible to buy real estate much below its true value. The difference is that with stocks, because they are so easy to buy and sell as well as having a low barrier to entry, these fluctuations can be much bigger and faster.
Now that we know that the real value of a publicly traded company and its stocks are not always the same, how do we determine its true value? This is where it gets a little more complicated. There is a lot of debate here. You can talk about trends, you can talk about potential, deals coming up, patents, etc. That’s all fine, but for the scope of this article, we’ll only focus on hard nosed financial facts and figures. How much equity does the company really have? The first place to look is the balance sheet (which is available through SEC fillings and many online sites such as Yahoo Finance).
For our example, we’ll use a really well established company like Microsoft through the Yahoo Finance website. Generally balance sheets are divided into two sections, assets and liabilities. This is just like any investment real estate property or business. In assets section you want to know the hard values of the items you’re purchasing. For a publicly traded company, the easiest hard asset is cash. What’s the cash balance? For Microsoft in June 2005 it is $37.75 billion. That is, if the company went bankrupt tomorrow, assuming no debt, they could give out $37.75 billion to all the shareholders ($3.52/share).
What other hard assets can a company have? Many. It can own factories, inventory, etc. The only issue I have with this is that if the company went bankrupt tomorrow, you might not be able to sell these assets at full value. Therefore you should recalculate the balance sheet to reduce the assets at a discounted value. How much? That depends on the industry and how much security you wish to pad your price with. I like to be conservative myself, so I really low ball these assets.
One word of warning when calculating other assets, there are two rows you need to be extremely careful of, they are intangibles and goodwill. Without going into too many details, these are items that have no real hard assets behind them, that is if the company disappeared tomorrow, that value wouldn’t be paid out in cash to you. Examples can include the value of a brand name. How much is the name brand “Coke” worth? “Microsoft”? That is how much people buy their products because they know the name. The answer is that it depends. It’s worth something, but how much can’t really be determined.
Another item that’s often added here is the premium paid when a company acquires another. For example, if a company acquires another that was going for $1,000,000 but they paid $1,250,000, then you would add $250,000 as goodwill. This is the premium paid to acquire a company (which is very common). Therefore to be safe I completely discount these two rows because to me they have no really definable value that I can easily equate. This is just like how much is it worth to have beach front property? It’s definitely worth something but how much exactly I don’t know, there are just too many variables to be anywhere near accurate. Therefore to be safe I don’t assign any values to it and therefore I’m excited when I find a beach front property that has a balance sheet exactly as one that isn’t beach front!
The second section is debt. Debt can be your friend, but in business it’s a liability. These are payments you need to make every month. You need to verify that the company you are buying is not overloaded with debt. This is the same as verifying that you yourself are not overloaded with debt when purchasing a real estate investment property or a small business. You need to verify that the company can service its debt otherwise it will go bankrupt. What’s too much, well that depends again. Each industry is different and each business is different. I personally like to play it safe and avoid companies that have more than 25% of their cash reserves in debt. I understand this is stringent, but I don’t like to lose! No debt is even better when it comes to acquiring a business. Imagine if you could buy two real estate investment properties for the same amount of money, but one would require you to be in debt while another wouldn’t. Which is better?
Another thing to avoid is companies that grow through solely through debt. You can grow through debt, but eventually a company will cap out. Think of it this way, if the only way you could grow your real estate portfolio is 100% through financing (not from re-investing profits from your current properties), then eventually you will get crushed by a downturn in the market or by a lack of acquire future funding. You want some margin for safety. If I went out and bought every rental property I could with 100% financing, at some point I would get crushed. I might last a while, but if interest rates climb by even a small rate, or if one of my properties has some problems for even a short time, I’m at risk of collapsing my entire portfolio. The same is true for companies.
Now that we quickly looked at the balance sheet, what about the cash flow statement? When you buy an investment real estate rental property, you should definitely look at cash flow. Is the company consistently generating positive cash flow? Would you buy a real estate rental property that’s generating negative cash flow (assuming you couldn’t do anything to fix it yourself because you can’t personally manage a publicly traded company either)? I wouldn’t. So why is this important aspect so often ignored? I wish I knew… However, the reality is that it is often completely overlooked.
Looking at a publicly traded company’s cash flow statement is almost the same as looking at real estate property’s cash flow statement. For example, if we look at Microsoft’s, we can quickly see their yearly cash flow is positive with the exception of this year (2005), which was highly negative in comparison. In this particular case, rather than completely dismiss the company without looking further, we can quickly see on the cash flow statement that the reason it had such a negative amount is that it paid a one time dividend of $36 billion dollars! There’s no way the cash flow cannot be affected by such a large dividend. However, on a normal basis, what we’re looking for is a consistent positive cash flow, just like a real estate rental property. Sometimes you’ll get the odd inconsistency, however overall you want positive consistency.
There are many other aspects of publicly traded companies that are almost identical to real estate rental properties (and commercial properties). However for the scope of this article we’ll stop here today. The idea is that if you take the same amount of time and pay the same amount of attention to your real estate rental properties as you do to purchasing stocks, you’ll probably come out ahead. If you don’t, then you probably should look at buy index funds because they basically mimic the market average. You will never beat it, but you will also never lose to it. For the astute investor who has the time and is willing to put in the effort, the rewards can be very positive, I can assure you from personal experience.
Before I end this article, just a couple of other quick tips for you when purchasing stocks. Firstly, pay careful attention to ROE (Return On Equity), it’s one of the metrics I use myself very religiously. This metric is basically supposed to measure the return on the value of the equity. So if you have an ROE of 15%, then the true business value (the value of the assets of the company) as suppose to increase by 15% for the year. Please note that you should calculate this value yourself, after you’ve made the adjustments we talked about above. For example, a company can say that its brand value is increasing by 50% a year while its real hard assets are actually decreasing by 35% in value each year, giving it an ROE of 15%. This could give you a nice looking positive ROE where in reality it’s very negative. I’ve seen this very legal trick played much too often.
The other tip is to avoid company’s that inconsistently take huge financial hits in down markets. Without naming names here, there are several companies over the last 2-3 years that have taken large losses, larger than they acquired in any one year. You can do this for many reasons, for adjustments, right-offs, etc. However some companies use this to absorb all their losses during a down market, when their stock price is already depressed. This way they can absorb losses for many years at one time while the stock is already low, after all it can only go so low. Then when the market picks back up, their profits are back, because the losses they should have claimed for that year are all used in that one bad year. This way they can have one extremely bad year and maybe 5 or so good years. However, if you average the company over say 7 years, then the rosy picture of the 5 good years no longer look so good. This is the same as someone who inflates their real estate rental income just before they sell. For example, they can pay all the regular expenses a year or two beforehand by buying all their supplies and stock piling them in anticipation, making the property look cheaper. The can also keep their entire inventory loss (renovations, etc.) and write it all off as one massive loss in one single year. There are many tricks that can be used to inflate the real price that can be used for any investment asset, including real estate and business. Real investors can generally see these, or at least have lots of red flags firing off left and right when they encounter them. I personally don’t believe in these tactics, but I do need to be aware of them to properly and correctly valuation all of my investment assets.
Lastly, if you are interested in buying stocks, then there are definitely some books I think you should at least read. If you’re only going to read one book, then I would suggest the The Intelligent Investor: The Definitive Book On Value Investing, Revised Edition by Benjamin Graham. It’s not a complete book on stock investing, there are more enhanced ways of valuating companies, but it’s a great start at understanding the fundamentals. After all, he’s the one who thought Warren Buffett how to invest in stocks. In any case, please find below a quick list I compiled of some of the books I found very informative (in no particular order):
The Intelligent Investor: The Definitive Book On Value Investing, Revised Edition
The Warren Buffett Way, Second Edition
The Essays of Warren Buffett : Lessons for Corporate America
Security Analysis: The Classic 1940 Edition
Reminiscences of a Stock Operator (A Marketplace Book)
When Genius Failed : The Rise and Fall of Long-Term Capital Management
Take On the Street: What Wall Street and Corporate America Don’t Want You to Know
Buffett : The Making of an American Capitalist
How to Lie With Statistics
Permalink to this article Discussions (0)
| « PREVIOUS PAGE | NEXT PAGE » |