LandlordMax And FollowSteph as Graphs
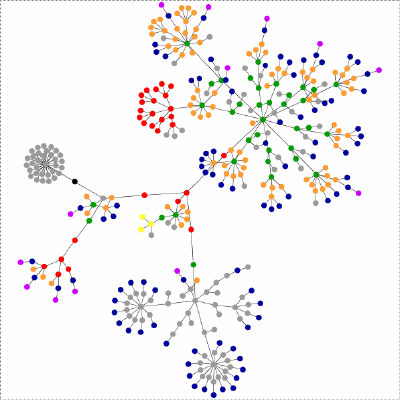
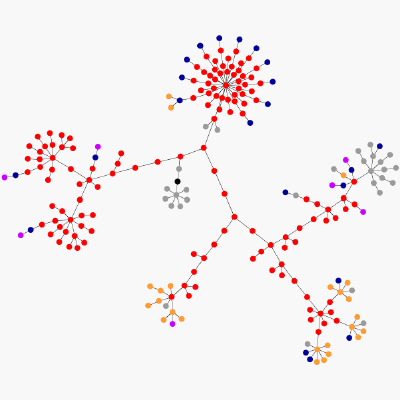
Today’s entry is very different than usual. I came accross a website graph of Problogger.net today that was generated with Websites as graphs – an HTML DOM Visualizer Applet. It was unique and interesting enough that I generated one for each of LandlordMax.com and FollowSteph.com which you can find below:


red: for tables (TABLE, TR and TD tags)
green: for the DIV tag
violet: for images (the IMG tag)
yellow: for forms (FORM, INPUT, TEXTAREA, SELECT and OPTION tags)
orange: for linebreaks and blockquotes (BR, P, and BLOCKQUOTE tags)
black: the HTML tag, the root node
gray: all other tags


