Asset Risk Management
Today’s article has been inspired from a book I’m currently reading entitled Fortune’s Formula. Although the book is fairly verbose, it’s worth the read because it does have some very interesting insights and ideas. The main focus of the book is how to manage risk of your assets, regardless of what the asset is. For example, it compares the Kelly System (original paper in pdf format), the Markowitz system, etc. The basic idea is how can you increase your wealth the fastest while minimizing your risk.
Although I’m not yet finished reading it, one chapter really caught my attention. entitled “Shannon’s Demon”. In there the author (William Poundstone) talks about a system devised by Claude Shannon where it appears theoretically possible, and I’ll explain why I say theoretically in a bit, to make profit from the fluctuations of an asset (both when it goes down and up).
The system is very simple and elegant. You start with a certain amount of cash, let’s say $200. You divide this sum equally into cash ($100) and the asset ($100). Then each round (time unit which can be minute, hour, day, month, year, whatever) the asset either doubles or halves. Yes, it can halve and you can still make money! Now at the end of each round you rebalance your portfolio to split the cash and assets 50/50. So for example, if the asset doubles to $200, then you rebalance your wealth ($300 = $200 asset and $100 cash) so that you have $150 in cash and $150 in asset. If it halves, you rebalance it ($150 = $50 asset and $100 cash) so you have $75 in each. You repeat this for as many time steps as you want and you will find that the result is a geometric (i.e. exponential).
In the previous paragraph I allude to the idea that it was theoretically possible. Why did I say this? Because reality doesn’t quite allow for this system to be possible. Firstly, if you were to wait until real estate or stocks doubled and halved it might take a very long time. Therefore this would only be possible with games of change with an even odd of winning and losing. The other aspect is that if you actually went ahead and did this with either real estate or stocks, you’d have to take into consideration fees of buying and selling the assets, not to mention tax considerations. However, ignoring these aspects, it’s a very interesting and thought provoking idea because it really helps to appreciate that it is possible to make money on volatile assets that move up and down.
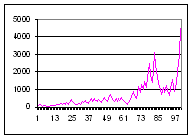
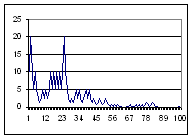
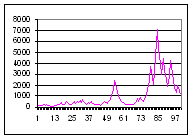
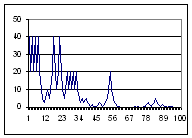
I took a few minutes tonight to write a simple Java program to test this concept. For you technical people, you can find the source code here and the class file here. The program will output to the screen tab delimited lines which you can use in MS Excel to generate the graphs. In any case, I ran it a number of times with runs of 100 time units with equal probabilities of the asset going up and down. What was very interesting is that no matter what, assuming the asset didn’t go bankrupt, you made exponential revenue. If the asset did go bankrupt, you still made a nice profit up to that point (assuming it didn’t go bankrupt right away and lasted for at least a few up movements). You’ll find 5 of these sample runs below with the wealth graph on the left and the respective asset price graph on the right (the asset always started with a $20 value and the wealth with $100 cash and $100 in assets).
Scenario 1 (Data File)
Scenario 2 (Data File)
Scenario 3 (Data File)
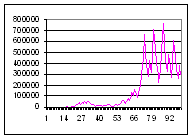
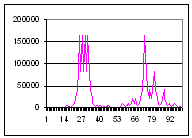
Scenario 4 (Data File)
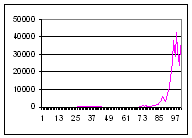
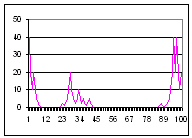
Scenario 5 (Data File)
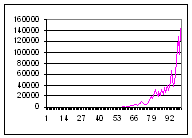
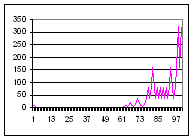
As you can see from every single graph above, no matter how low or high the asset price went, it still seemed to generate a handsome profit. Although I didn’t post any of the graphs where the asset loses all of its value, you can see from some of the examples that even when the asset price is almost completely wiped out the wealth graph is still much higher than the original $200 in wealth. It’s also much higher than if you had just stayed and rode the stock all along!
Of course please don’t think that I’m proposing that getting in and out of the assets is necessarily a good thing, because like I mentionned before, once you start to take into account the transaction costs and capital tax costs, not to mention the amount of time it takes for a normal asset to double and halve, it pretty much makes this model impossible. I still strongly believe in the buy and hold model and therefore this article is more to bring forth some new ideas and ways of thinking about assets and risk management.


· February 11th, 2008 · 8:29 am · Permalink
[…] Asset Risk Management […]
· January 28th, 2015 · 2:48 am · Permalink
I can’t follow your numbers and the graphs don’t make sense to me. The 2005 era links are no longer active so you can’t see what’s behind those charts. But your two sets of charts are asset value and total value. I can’t understand why the total value is always going up when the asset value declines.
In my Excel model, I used Excel’s RAND function to to generate a random real number between -1 and +1. The principle I followed is the Shannon Rebalanced Portfolio so after each round the investment is rebalanced to 50% / 50%. The net effect is a matter of delaying a declining trend, but if there are sustained losses, eventually the total value has to decline as well. So this rebalance strategy is effective in tempering risk, but it also limits upside. If you have a highly volatile investment within an uptrend you could make a good return with a moderate amount of risk.
· May 14th, 2015 · 3:18 pm · Permalink
Hi Andy,
I honestly don’t remember the technical details because I did this 10 years ago. Unfortunately during that time I’ve moved the blog more than once and have lost some data to the links in the blog. So even if I did look at your spreadsheet, I don’t know that I’d remember the details enough to comment intelligently.
That being said I do remember being quite surprised when I tried it, it didn’t make sense to me either. How could you still be making money if the assets were depreciating, however when I ran the numbers through computer programs it worked.
The best advice I can offer is to get a copy of the book Fortune’s Formula. It contained all the details and information I needed to be able to run those tests. Plus it’s also an amazing book overall.